Quality control
Last updated on 2024-03-05 | Edit this page
Estimated time: 20 minutes
Overview
Questions
- How can we carry out basic quality control and quality assurance in spreadsheets?
Objectives
- Apply quality control techniques to identify errors in spreadsheets and limit incorrect data entry.
Remember how two different field assistants recorded data in their own way inside the messy spreadsheet? When data is not recorded in a consistent way it is very difficult to work with, and often a lot of time has to be spent cleaning it and fixing it first. How do we avoid this? One way is to use the built-in features of spreadsheet software to ensure data is entered in a consistent way.
These approaches include techniques that are implemented prior to entering data (quality assurance) and techniques that are used after entering data to check for errors (quality control).
Note
If you have used formulas in your spreadsheet, then before doing any quality control operations it’s best to save your spreadsheet and create a new copy. In the new copy, copy the contents and paste as values so the formulas are removed. Because formulas refer to other cells, and you may be moving cells around, you may compromise the integrity of your data if you do not take this step.
Quality Assurance
Quality assurance prevents errors from being introduced into the spreadsheet by checking to see if values are valid during data entry. For example, if research is being conducted at sites A, B, and C, then the value V (which is right next to B on the keyboard) should never be entered. Likewise if one of the kinds of data being collected is a count, only integers (whole numbers) greater than or equal to zero should be allowed.
To control the kind of data entered into a spreadsheet we use Data Validation (Excel) or Validity (Libre Office Calc), to set the values that can be entered in each data column:
1. Select the cells or column you want to validate
2. On the Data tab select
Data Validation
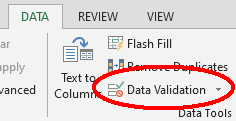
3. In the Allow box select the kind of data that should
be in the column. Options include whole numbers, decimals, lists of
items, dates, and other values.
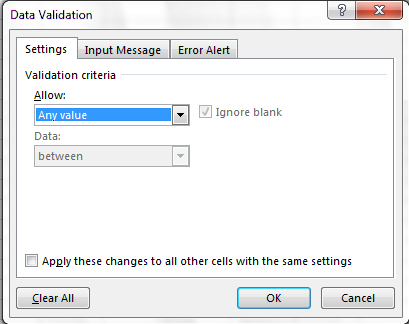
4. After selecting an item enter any additional details. For example,
if you’ve chosen a list of values, enter a comma-delimited or semi-colon
list of allowable values in the Source box.
Let’s try this out. Open up the cleaned data.
- Select the
plotcolumn. - On the
Datatab selectData Validation - In the
Allowbox selectWhole number - Set the minimum and maximum values to 1 and 24.
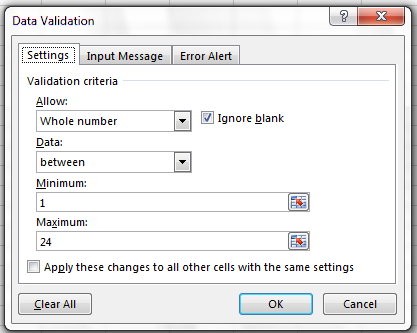
Now let’s try entering a new value in the plot column that isn’t a valid plot. The spreadsheet stops us from entering the wrong value and asks us if we would like to try again.

You can also customise the resulting message to be more informative
by entering your own message in the Input Message tab
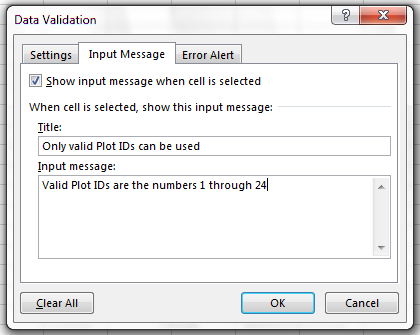
You can also restrict data entry to a list of options in a dropdown list. So, instead of trying to remember how to spell Dipodomys spectabilis, you can select the right option from the list.
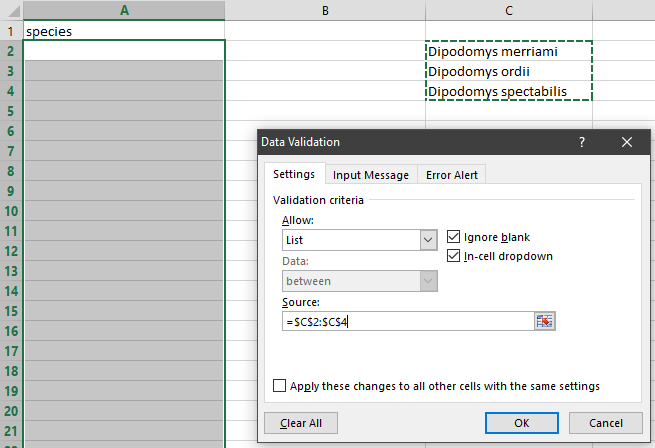
Quality Control
Manual sorting
Bad values often sort to the bottom or top of the column. For example, if your data should be numeric, then alphabetical and null data will group at the ends of the sorted data. Sort your data by each field, one at a time. Scan through each column, but pay the most attention to the top and the bottom of a column. If your dataset is well-structured and does not contain formulas, sorting should never affect the integrity of your dataset. Remember to expand your sort to prevent data corruption. Expanding your sort ensures that all the data in one row move together instead of only sorting a single column in isolation. Sorting by only a single column will scramble your data - a single row will no longer represent an individual observation.
Conditional formatting
Conditional formatting can highlight bad values based on certain criteria. This makes it easy to scan your data for errors. Conditional formatting should be used with caution, but it can be a great way to flag inconsistent values when entering data.
Exercise
Let’s check the weight column in our cleaned data to flag
suspicious values with conditional formatting. Let’s assume that we’re
not expecting to see any weights under 10 grams or over 200 grams.
- Select the
weightcolumn. - In the main Excel menu bar, click Home > Conditional Formatting > Manage rules.
- Select New Rule, then in the ‘Select a rule type box’, select ‘Format only cells that contain’.
- In the ‘Rule description’ box, change
betweentonot between, and enter10and200in the boxes. - Now select the ‘Format’ box, ‘Fill’ tab, and select a colour. Select OK on each dialog box.
What kind of values have been highlighted in the weight
column?
All cells containing numbers below 10, above 200, or with blank values, should now be highlighted.
These kinds of checks are useful to ensure your data does not have errors introduced, but it’s worth knowing we can also perform much more powerful checks in tools like Openrefine and R.
- Always copy your original spreadsheet file and work with a copy so you don’t affect the raw data.
- Use data validation to prevent accidentally entering invalid data.
- Use sorting to check for invalid data.
- Use conditional formatting (cautiously) to check for invalid data.
