Content from Introduction
Last updated on 2024-04-08 | Edit this page
Estimated time: 15 minutes
Overview
Questions
- What are some basic principles for organising research files?
Objectives
- Describe best practices for keeping research projects organised.
Project Organisation
Organising digital files into projects and managing them effectively are essential skills for researchers, but are seldom taught at university. The following list of practices are a useful starting point for you to adapt to your own needs.
- Use sensible folder and file names
Each research project should have it’s own project directory (folder) containing files organised into a consistent set of subfolders. Each discrete set of data resulting in a publication may have it’s own project folder, or perhaps each grant has it’s own project folder containing the datasets and manuscripts generated as part of the overall project.
Every project will have different needs, but using a set of common subfolders means you will always know where certain files live. For example:
-
data_raw: Keep raw, unedited data files here. -
data_clean: Keep cleaned/transformed datasets here. -
figs: Keep figures and tables here. -
docs: Keep manuscripts, lab notebooks, and other documents here. -
scripts: Keep scripts or code documents here.
Like folder names, filenames should:
- Be short, descriptive, and consistent.
- Avoid special characters and spaces.
- Conform to a schema or template.
For example, 2020-01-20_bird-counts_north.csv contains a
date, subject, and location in three fields separated by underscores.
Files will sort based on date because it is the first field.
- Back up your files
Ensure you’re not the victim of data loss by backing up your research projects, or better yet, store them on a platform or service that is automatically backed up for you. The University of Auckland provides Research Drive and Dropbox team folders for researchers and postgraduate research students. Both are backed up automatically. See here for more information.
- Keep a copy of the raw data
Keep a copy of all raw data files, whether they are generated by an instrument, software package, or transcribed by hand. It is essential to maintain the provenance of data in order to respond to questions from funders, institutions, and journal reviewers, should they arise. Having a copy of the raw data also means you can easily recreate any figures or results.
If you need to manually tidy or transform the data, it’s best to make your changes to a copy to preserve the original raw data. But limit the number of copies you make so as not to create more work having to update data in multiple locations.
- Create ‘tidy’ spreadsheets
Tidy spreadsheets are those where:
- Each variable has its own column.
- Each observation has its own row.
- Each cell contains a single value.
The idea is to ensure data is structured in a way that computers are expecting, in order to use programming languages like R or Python later on. We’ll cover this more in the next episode.
- Describe your project with a README
A README is a plain text file (.txt) that lives in the project folder and contains as much information about your project as you think would be needed for another person (or your future self) to understand it. Suggested content includes:
- Title, abstract, authors, funders
- What the folders and files contain and how they relate to each other
- How data was generated, instrument/software settings
- Column names and units
- How data has been changed/transformed (if done manually)
Exercise
Have a go at creating a README for the project/data you’re currently working on.
- Create a
.txtfile.- Windows: Right click the Desktop > New > Text Document >
rename to
README.txt - Mac: Finder > Applications > Open TextEdit > Click New Document > Click the Format tab > Click ‘Make Plain Text’
- Windows: Right click the Desktop > New > Text Document >
rename to
- Enter the following details:
- Title
- Abstract (just one sentence for now)
- Authors
- The name of one of your main spreadsheet files
- The name of 3 columns/variables in your spreadsheet, a brief description, and their units
- Save the file.
- Windows:
Ctrl+S - Mac:
Cmd+Sand rename asREADME.txt
- Windows:
See here for more information about READMEs.
Lesson structure
Many researchers commonly work with data in spreadsheets, so the rest of this lesson focuses on tidying tabular data:
- Formatting data tables in spreadsheets
- Formatting problems
- Dates as data
- Quality control
- Exporting data
- Good project organisation encompasses the naming, arrangement, backing up, and documenting of files.
- Time invested into project organisation is paid back multiple times over during a project.
For a more expansive view of good project organisation, see Good enough practices in scientific computing by Greg Wilson and colleagues, published in PLoS Computational Biology.
Content from Formatting data tables in Spreadsheets
Last updated on 2024-04-08 | Edit this page
Estimated time: 35 minutes
Overview
Questions
- How do we properly format data in spreadsheets?
Objectives
- Describe best practices for data entry and formatting in spreadsheets.
- Apply best practices to arrange variables and observations in a spreadsheet.
- Understand the differences between long and wide format data.
Spreadsheets are common in research environments, yet many researchers are never taught how to properly format tabular data to ensure it is easy to analyse later. Since most researchers use Excel as their primary spreadsheet software, the rest of this lesson will make use of examples using Excel. Free alternatives including LibreOffice Calc and Google Sheets can be used, but commands and options may differ between software.
What this lesson will not teach you
- How to do statistics in a spreadsheet
- How to do plotting in a spreadsheet
- How to write code in spreadsheet programs
Doing statistics, plotting data, writing code, and doing in-depth data cleaning are best handled by other software which has been designed for these tasks. Data Carpentry includes lessons on Openrefine and R, which are better suited to performing these kinds of operations.
Problems with Spreadsheets
Spreadsheet programs like Excel were originally designed to handle the entry, manipulation, and plotting of financial data. It’s easy to run into problems when working with research data when we forget Excel’s purpose and limitations. For example:
- Be very cautious when opening and saving research data in Excel because by default it automatically reformats certain types of data, and this can introduce major errors into your data (we’ll explore an example later when we talk about dates).
- Making tables ‘pretty’ with merged cells, borders, highlighting, and notes in the margin mean that the data will not be recognised when imported into specialised data analysis software, and will first require time-consuming manual clean up.
- Statistics and figures generated within ‘point and click’ software like Excel cannot be reproduced by someone else without detailed instructions, and it’s easy to introduce errors when creating plots by hand.
But spreadsheet software also has some useful features to help us to keep our data error-free and formatted correctly.
Structuring Data in Spreadsheets
The number one rule for working with tabular data in spreadsheet software is to keep it “tidy”:
- Put all your variables in columns - the things you’re measuring, like ‘weight’ or ‘temperature’.
- Put each observation in its own row.
- Don’t combine multiple pieces of information in one cell. You want maximum freedom to sort or subset your data later on.
Portal Project Teaching Dataset
The data used across the Data Carpentry lessons is a simplified version of the Portal Project Database - a dataset containing observations of rodents in southern Arizona as part of a project studying the effects of rodents and ants on the plant community. The rodents are captured in a series of 24 plots, with different experimental manipulations controlling which rodents are allowed to access which plots. Measurements are recorded for each captured rodent.
The study has been running for almost 40 years and the full dataset has been used in over 100 publications. The data we’re going to look at has been simplified a little bit for the workshop, but the full version is available to download if you’re interested.
Exercise
We’re going to open up a messy version of a spreadsheet containing some of the Portal data. You can get a copy of the spreadsheet here.
You can see that the data is spread across two tabs within this Excel
workbook. Let’s assume two field assistants conducted the surveys, one
in 2013 and one in 2014, and they both kept track of the data in their
own way in tabs 2013 and 2014 of the workbook.
Let’s say you were the person in charge of this project and you wanted
to start analysing the data.
In the chat, identify issues with the data which would make it difficult to understand or analyse.
- All the mistakes in 02-common-mistakes are present in the messy dataset. As different points are brought up, refer to 02-common-mistakes or expand a bit on the point.
Tidied Data
Download a cleaned version of the messy data here to see what a tidy version of this dataset looks like. It’s worth opening up the messy and cleaned spreadsheet side by side to compare the difference. Points to consider:
- Multiple tables have been combined into a single table where each observation has it’s own row.
- Column headings (or variable names) have been simplified.
- The species-sex values from one of the 2014 tables have been broken up.
- Missing data is represented by blank cells.
- A
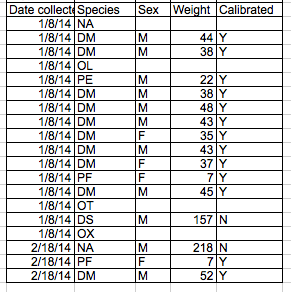
calibratedcolumn has been added to remove the need for messy formatting. - The date column has been split into 3 separate columns - more on this later.
This tidy dataset is an example of data in ‘long format’. However, we tend to be more familiar with data in ‘wide’ format because that is often how people store data in spreadsheets.
For example, say you have several subjects and you are measuring a variable each day for each subject. The data would look like this in wide format:
| subject | sex | region | day1 | day2 | day3 |
|---|---|---|---|---|---|
| 001 | m | nth | 2.5 | 2.7 | 2.6 |
| 002 | f | sth | 3.1 | 5.2 | 4.3 |
| 003 | f | wst | 4.2 | 5.1 | 3.9 |
Data in wide format expands by adding more columns to the right. If we continued taking a measurment from each subject for 3 more days we would add day4-day6 as columns to the right.
Data in long format, however, expands by adding additional rows below. The above data in long format would look like this:
| subject | sex | region | day | value |
|---|---|---|---|---|
| 001 | m | nth | 1 | 2.5 |
| 001 | m | nth | 2 | 2.7 |
| 001 | m | nth | 3 | 2.6 |
| 002 | f | sth | 1 | 3.1 |
| 002 | f | sth | 2 | 5.2 |
| 002 | f | sth | 3 | 4.3 |
| 003 | f | wst | 1 | 4.2 |
| 003 | f | wst | 2 | 5.1 |
| 003 | f | wst | 3 | 3.9 |
You can see how day has been added as it’s own column,
and each measurement has gone into the value column. Note
also how subject, sex, and region
are repeated to give each value it’s own row. This means
long format data is often larger than wide format datas.
Data in ‘long’ format is often much easier to do statsitics on and to visualise in plots, and this is especially the case with programming languages like R and Python. Therefore it is generally best to store data in long format so that you have maximum flexibility to subset the data any way you want.
We’ll learn how to switch between long and wide format data later in the R lesson.
- Never modify your raw data. Always make a copy before making any changes.
- Keep track of all of the steps you take to clean your data in a plain text file.
- Organize your data according to tidy data principles.
- Store your data in long format for maximum freedom when manipulating it later.
Content from Formatting problems
Last updated on 2024-03-25 | Edit this page
Estimated time: 20 minutes
Overview
Questions
- What are some common challenges with formatting data in spreadsheets and how can we avoid them?
Objectives
- Recognise and resolve common spreadsheet formatting problems.
Common Spreadsheet Errors
This episode is used as a reference for discussion as learners identify issues with the messy dataset discussed in the previous episode.
Instructors: don’t go through this episode except to refer to responses to the exercise in the previous episode.
- Common Spreadsheet Errors
- Using multiple tables {#tables}
- Using multiple tabs {#tabs}
- Adding column headers into your data {#headers}
- Not filling in zeros {#zeros}
- Using problematic null values {#null}
- Using formatting to convey information {#formatting}
- Using formatting to make the data sheet look pretty {#formatting-pretty}
- Placing comments or units in cells {#units}
- Entering more than one piece of information in a cell {#info}
- Using problematic variable names {#variable-name}
- Using special characters in data {#special}
- Inclusion of metadata in data table {#metadata}
Using multiple tables
Creating multiple tables within one spreadsheet might seem convenient, but:
- you won’t be able to import the data into specialised analyses software because it confuses the computer.
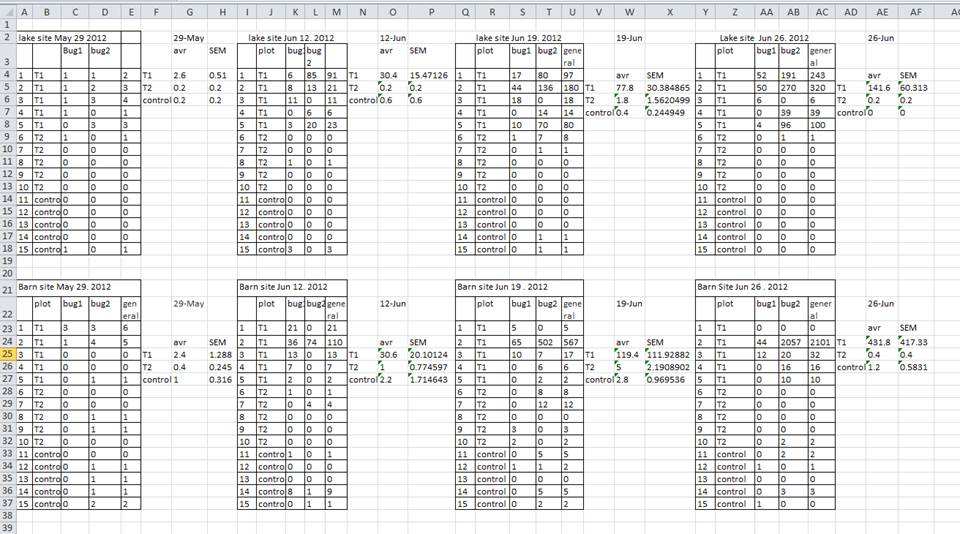
In the example above, the computer will see (for example) row 4 and assume that all columns A-AF refer to the same sample. This row actually represents four distinct samples.
Using multiple tabs
Creating multiple spreadsheets in separate tabs might seem convenient, but:
- you’re more likely to accidentally add inconsistencies if your data is split between multiple tabs
- you’ll need to combine the data into a single table to analyse them together anyway.
If the tabs are inconsistently formatted, you might have to combine them manually. Better to add different dates as a variable within a single unified table. Before adding a tab ask yourself if it’s actually a new column you need to add.
Adding column headers into your data
Your data sheet might get very long over the course of your work. This makes it harder to enter data if you can’t see your headers at the top of the spreadsheet. But don’t repeat your header row. These can easily get mixed into the data, leading to problems down the road.
Instead you can freeze the column headers so that they remain visible even when you have a spreadsheet with many rows.
Not filling in zeros
There is a very important difference between a zero and a blank cell in a spreadsheet. To the computer, a zero is actually data that you measured or counted, whereas a blank cell means that it wasn’t measured and will be interpreted as an unknown (or ‘null’) value.
Spreadsheet or statistical software will likely misinterpret blank cells if you intend them to be zeros. By not entering the value of your observation, you are telling your computer to represent that data as unknown or missing (null). This can cause problems with subsequent calculations or analyses. For example, when averaging a set of numbers, null values are excluded, because the computer can’t guess the value of the missing observation. Because of this, it’s very important to record zeros as zeros and truly missing data as blank cells.
Using problematic null values
There are many reasons why null values are represented differently within a dataset. Sometimes confusing null values are automatically recorded from the measuring device. If that’s the case, there’s not much you can do, but it can be addressed in data cleaning with a tool like OpenRefine before analysing or sharing. In other cases, null values are used to convey different reasons why the data is missing. This is important information to capture, but instead of using one column to capture two pieces of information, it would be better to create a new column like ‘data_missing’ and use that column to capture the different reasons.
For missing data, blank cells are usually the best choice.
Using formatting to convey information
Sometimes people use formatting to convey information which should be captured elsewhere. For example: - highlighting cells, rows, or columns that should be excluded from an analysis - leaving blank rows to indicate separations in data
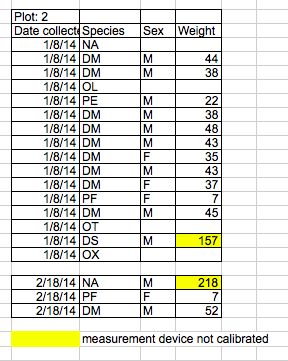
A better solution is to create a new column to encode which data should be excluded.
Using formatting to make the data sheet look pretty
Sometimes people use formatting to make the spreadsheet look nice. For example, by merging cells. But this will make your data unreadable by statistical software.
Placing comments or units in cells
If you need a way to incorporae important notes about certain data in the spreadsheet, create a new column to identify observations which may be suspect. You can put information such as units or calibration information within your README.
Entering more than one piece of information in a cell
Don’t include more than one piece of information in a cell. This will limit the ways in which you can analyse your data. If you need both these measurements, design your data sheet to include this information. For example, include one column for number of individuals and a separate column for sex.
Using problematic variable names
Choose descriptive variable/column names, and be careful not to include spaces, numbers, or special characters of any kind. Spaces can be misinterpreted by parsers that use whitespace as delimiters and some programs don’t like field names that are text strings that start with numbers.
Consider using ‘lower_snake’ case (lower case words separated by underscores) for variable/column names.
Remember to define your variable names and state the units in your README file.
Using special characters in data
Avoid copying data directly from Word or other applications, because line breaks, em-dashes, formatting and non-standard characters (such as left- and right-aligned quotation marks) are included. When exporting this data into a coding/statistical environment or into a relational database, dangerous things may occur, such as lines being cut in half and encoding errors being thrown.
General best practice is to avoid adding characters such as newlines, tabs, and vertical tabs. In other words, treat a text cell as if it were a simple web form that can only contain text and spaces.
Inclusion of metadata in data table
Recording data about your data (“metadata”) is essential. You may be on intimate terms with your dataset while you are collecting and analysing it, but the chances that you will still remember that the variable “sglmemgp” means single member of group, for example, or the exact algorithm you used to transform a variable or create a derived one, after a few months, a year, or more are slim.
There are many reasons other people may want to examine or use your data - to understand your findings, to verify your findings, to review your submitted publication, to replicate your results, to design a similar study, or even to archive your data for access and re-use by others. While digital data are usually in some way machine-readable, understanding their meaning is a job for human beings. The importance of documenting your data during the collection and analysis phase of your research cannot be overestimated, especially if your research is going to be part of the scholarly record.
However, metadata should not be contained in the data file itself. Rather, metadata should be stored in a separate file. A common convention is to create a plain text file (.txt) called README.txt and store this kind of contextual information about your data inside it. You can include project details such as authors, funders, abstract, as well as comments, units, information about how null values are encoded, and other information which is important to document but can disrupt the formatting of your data file.
- Avoid using multiple tables within one spreadsheet.
- Avoid spreading data across multiple tabs.
- Record zeros as zeros.
- Use an appropriate null value to record missing data.
- Don’t use formatting to convey information or to make your spreadsheet look pretty.
- Place comments in a separate column.
- Record units in column headers.
- Include only one piece of information in a cell.
- Avoid spaces, numbers and special characters in column headers.
- Avoid special characters in your data.
- Record metadata in a separate plain text README file.
Content from Dates as data
Last updated on 2024-04-15 | Edit this page
Estimated time: 13 minutes
Overview
Questions
- What is a safe approach for handling dates in spreadsheets?
Objectives
- Describe how dates are stored and formatted in spreadsheets.
- Demonstrate best practices for entering dates in spreadsheets.
Dates in spreadsheets can be a problem. A spreadsheet application may display dates in a seemingly correct way (to a human observer) while actually storing the date in a way that may cause issues.
Note
Most of the images of spreadsheets in this lesson come from Microsoft Excel running on a Mac or Windows PC.
Excel is famous within the scientific community for turning things that aren’t dates into dates. For example, many protein or gene names such as MAR1, DEC1, and OCT4 will automatically be changed into dates by Excel. And once overwritten, the original value of the cell is lost. In fact, a global body in charge of setting nomenclature for genes released guidelines in 2020 which included “symbols that affect data handling and retrieval” as one of the criteria which should be accounted for, in a reference to ongoing issues with Excel. Microsoft subsequently released an update to Excel in 2023 that allows users to disable automatic data conversion of these kinds of data into dates. This serves as an important cautionary tale!
Note
To turn off automatic data conversion for dates in Excel:
- On Windows: File > Options > Data > Automatic Data Conversion > Untick “Convert continuous numbers and letters to date”
- On Mac: Excel > Preferences > Edit > Automatic Data Conversion > > Untick “Convert continuous numbers and letters to date”
Note: This will only stop Excel from turning text/number combinations such as MAR4, DEC8, etc into dates. It will not prevent Excel from changing the way dates are interpreted and displayed based on regional settings. See below for more information.
Recommended date format
To avoid ambiguity, dates should be written as
yyyy-mm-dd. But Excel and other spreadsheet software tend
to transform this data into their own date formats, changing the
underlying data in the process.
For example, take the date 2024-01-13. When you add this
value to a cell inside a new Excel spreadsheet (.xlsx) and
save the spreadsheet in the same format, the date is overwritten to
13/01/2024. Similarly, when you add this date to a cell
inside a new Excel spreadsheet (.xlsx) and save the
spreadsheet in a plain text format (.csv), the date is
again overwritten to 13/01/2024. Even when you create a new
plain text spreadsheet (.csv) and save the file in
.csv format, the date is overwritten to
13/01/2024. Even when you pre-format a column as ‘text’
(right click the column label > format cells > Text), and enter
the date, it will be stored correctly and display correctly. However,
when this spreadsheet file is opened back up again in Excel the date is
reinterpreted by Excel, converted to it’s internal format, and
overwritten as 13/01/2024.
Why is Excel doing this? When data is imported into Excel, it will automatically identify cells containing dates and convert these into it’s internal date format. In the background, Excel stores dates as integers, and then picks a format to display them with based on your computer’s regional date settings.
While it is possible to stop this from happening by changing your
regional date settings, whenever someone else (like your supervisor or
colleague) opens and saves the file, the dates will be converted based
on their regional date settings, which means they are likely to end up
back in 13/01/2024 format.
The only guaranteed way to avoid this is to make different columns to record year, month, and day separately. You can then join the date components up later on in the software used for analysis. If you already have dates in a single column, you can split them up using some handy Excel functions.
Exercise
Pulling day, month, and year out of dates entered into a single column.
- Open the
datestab in our messy spreadsheet and you will see the ‘plot 3’ table from the2014tab (that contains the problematic dates). - Create new columns for day, month, and year.
- Make sure the new columns are formatted as numbers, not dates, by selecting the columns, right-clicking them > format cells > number.
- Extract day, month, and year from the dates in the
Date collectedcolumn into the new columns by using:
YEAR()
MONTH()
DAY()
You can see that even though we expected the year to be 2014, the year is actually 2015. What happened here is that the field assistant who collected the data for year 2014 initially forgot to include their data for ‘plot 3’ in this dataset. They came back in 2015 to add the missing data into the dataset and entered the dates for ‘plot 3’ without the year. Excel automatically interpreted the year as 2015 - the year the data was entered into the spreadsheet and not the year the data was collected. The spreadsheet program introduced an error into the dataset without the field assistant realising.
 {alt=‘dates, exersize
1’ .output}
- Treating dates as multiple pieces of data rather than one makes them easier to handle.
Content from Quality control
Last updated on 2024-03-05 | Edit this page
Estimated time: 20 minutes
Overview
Questions
- How can we carry out basic quality control and quality assurance in spreadsheets?
Objectives
- Apply quality control techniques to identify errors in spreadsheets and limit incorrect data entry.
Remember how two different field assistants recorded data in their own way inside the messy spreadsheet? When data is not recorded in a consistent way it is very difficult to work with, and often a lot of time has to be spent cleaning it and fixing it first. How do we avoid this? One way is to use the built-in features of spreadsheet software to ensure data is entered in a consistent way.
These approaches include techniques that are implemented prior to entering data (quality assurance) and techniques that are used after entering data to check for errors (quality control).
Note
If you have used formulas in your spreadsheet, then before doing any quality control operations it’s best to save your spreadsheet and create a new copy. In the new copy, copy the contents and paste as values so the formulas are removed. Because formulas refer to other cells, and you may be moving cells around, you may compromise the integrity of your data if you do not take this step.
Quality Assurance
Quality assurance prevents errors from being introduced into the spreadsheet by checking to see if values are valid during data entry. For example, if research is being conducted at sites A, B, and C, then the value V (which is right next to B on the keyboard) should never be entered. Likewise if one of the kinds of data being collected is a count, only integers (whole numbers) greater than or equal to zero should be allowed.
To control the kind of data entered into a spreadsheet we use Data Validation (Excel) or Validity (Libre Office Calc), to set the values that can be entered in each data column:
1. Select the cells or column you want to validate
2. On the Data tab select
Data Validation
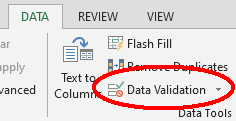
3. In the Allow box select the kind of data that should
be in the column. Options include whole numbers, decimals, lists of
items, dates, and other values.
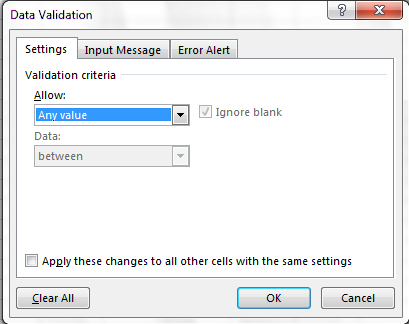
4. After selecting an item enter any additional details. For example,
if you’ve chosen a list of values, enter a comma-delimited or semi-colon
list of allowable values in the Source box.
Let’s try this out. Open up the cleaned data.
- Select the
plotcolumn. - On the
Datatab selectData Validation - In the
Allowbox selectWhole number - Set the minimum and maximum values to 1 and 24.
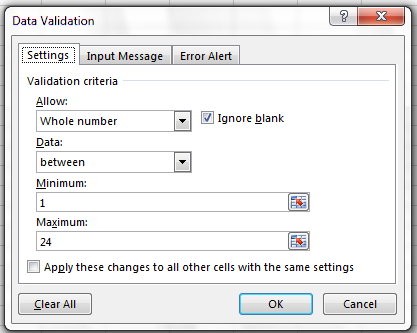
Now let’s try entering a new value in the plot column that isn’t a valid plot. The spreadsheet stops us from entering the wrong value and asks us if we would like to try again.

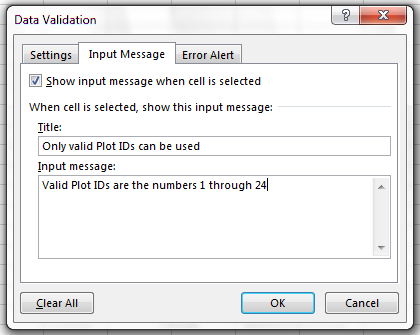
You can also customise the resulting message to be more informative
by entering your own message in the Input Message tab
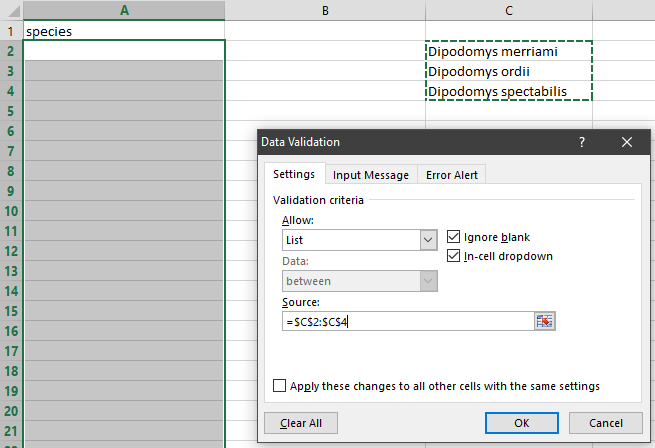
You can also restrict data entry to a list of options in a dropdown list. So, instead of trying to remember how to spell Dipodomys spectabilis, you can select the right option from the list.
Quality Control
Manual sorting
Bad values often sort to the bottom or top of the column. For example, if your data should be numeric, then alphabetical and null data will group at the ends of the sorted data. Sort your data by each field, one at a time. Scan through each column, but pay the most attention to the top and the bottom of a column. If your dataset is well-structured and does not contain formulas, sorting should never affect the integrity of your dataset. Remember to expand your sort to prevent data corruption. Expanding your sort ensures that all the data in one row move together instead of only sorting a single column in isolation. Sorting by only a single column will scramble your data - a single row will no longer represent an individual observation.
Conditional formatting
Conditional formatting can highlight bad values based on certain criteria. This makes it easy to scan your data for errors. Conditional formatting should be used with caution, but it can be a great way to flag inconsistent values when entering data.
Exercise
Let’s check the weight column in our cleaned data to flag
suspicious values with conditional formatting. Let’s assume that we’re
not expecting to see any weights under 10 grams or over 200 grams.
- Select the
weightcolumn. - In the main Excel menu bar, click Home > Conditional Formatting > Manage rules.
- Select New Rule, then in the ‘Select a rule type box’, select ‘Format only cells that contain’.
- In the ‘Rule description’ box, change
betweentonot between, and enter10and200in the boxes. - Now select the ‘Format’ box, ‘Fill’ tab, and select a colour. Select OK on each dialog box.
What kind of values have been highlighted in the weight
column?
All cells containing numbers below 10, above 200, or with blank values, should now be highlighted.
These kinds of checks are useful to ensure your data does not have errors introduced, but it’s worth knowing we can also perform much more powerful checks in tools like Openrefine and R.
- Always copy your original spreadsheet file and work with a copy so you don’t affect the raw data.
- Use data validation to prevent accidentally entering invalid data.
- Use sorting to check for invalid data.
- Use conditional formatting (cautiously) to check for invalid data.
Content from Exporting data
Last updated on 2024-03-05 | Edit this page
Estimated time: 10 minutes
Overview
Questions
- How can we export data from spreadsheets in a way that is useful for downstream applications?
Objectives
- Understand why storing spreadsheet data in universal file formats is best-practise.
- Export data from a spreadsheet to a CSV file.
Once you have created, collected, or transcribed your raw data and are ready to analyse it, it’s best practice to first export/save your data as a plain text format. Why should we do this?
Proprietary formats like
*.xlsor*.xlsxare designed to work with a commercial software application like Excel, whereas plain text formats are designed to be ‘open’ because virtually any software application can open and work with them. In the future, it is possible that proprietary formats will no longer be supported, or the software to open them may not be as common as it is now.Plain text formats are light weight, don’t save merged cells or other messy formatting, and therefore result in tidier files with smaller file sizes. This is especially advantageous when working with very large datasets, or large numbers of files.
Plain text formats are considered ‘best practice’ for storing research data and so are commonly used across disciplines. Funders, institutions, and publishers are increasingly requiring data to be published in a repository and linked to the peer-reviewed article to increase transparency, trust, and reproducibility. Research data repositories often expect you to upload spreadsheets as plain text files.
In practice, this means taking your completed Excel spreadsheet (in
*.xls or *.xlsx format), or LibreOffice
spreadsheet (.ods), and saving it as a plain text format
like .csv, which stands for ‘comma separated values’. CSV
files are quite literally values separated by commas - you can see this
by opening a CSV file in a text editor like Notepad or TextEdit.
Spreadsheet software like Excel and LibreOffice can save to plain text formats like CSV easily, although they may give you a scary-sounding warning when you save in a format other than their ‘own’ format. You can also open plain text formats in any spreadsheet software too.
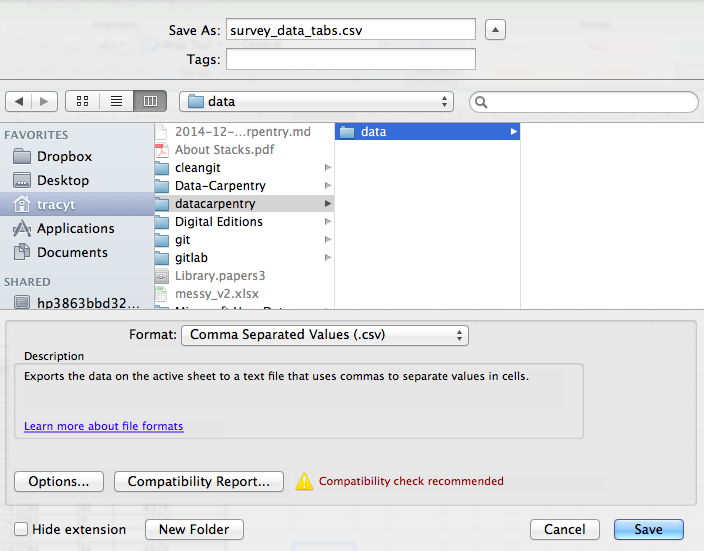
To save an Excel file in CSV format:
- From the top menu select ‘File’ and ‘Save as’.
- In the ‘Format’ field, from the list, select ‘Comma Separated
Values’ (
*.csv). - Double check the file name and the location where you want to save it and hit ‘Save’.
Special characters
By default, Microsoft Excel uses ANSI encoding which causes many special characters to display incorrectly. CSV files saved with UTF-8 encoding should display special characters properly, such as Chinese Characters. To import a .CSV file containing special characters, in Excel navigate to the Data tab > From Text/CSV > select the file and then in the import wizard select 65001 Unicode (UTF-8) from the Encoding dropdown. To save a CSV file with UTF-8 encoding, select ‘CSV UTF-8 (Comma delimited)’ from the ‘Format’ field when saving.
Caveats on commas
In some datasets, the data values themselves may include commas (,). This is particularly true in countries that use commas as decimal separators. In that case, the software which you use (including Excel) will most likely incorrectly display the data in columns. This is because the commas which are a part of the data values will be interpreted as delimiters between columns.
If you are working with data that contains commas, you likely will need to use another delimiter when working in a spreadsheet. In this case, consider using tabs as your delimiter and working with TSV files. TSV files can be exported from spreadsheet programs in the same way as CSV files.
- Data stored in common spreadsheet formats will often not be read correctly into data analysis software, introducing errors into your data.
- Exporting data from spreadsheets to formats like CSV or TSV puts it in a format that can be used consistently by most programs.
